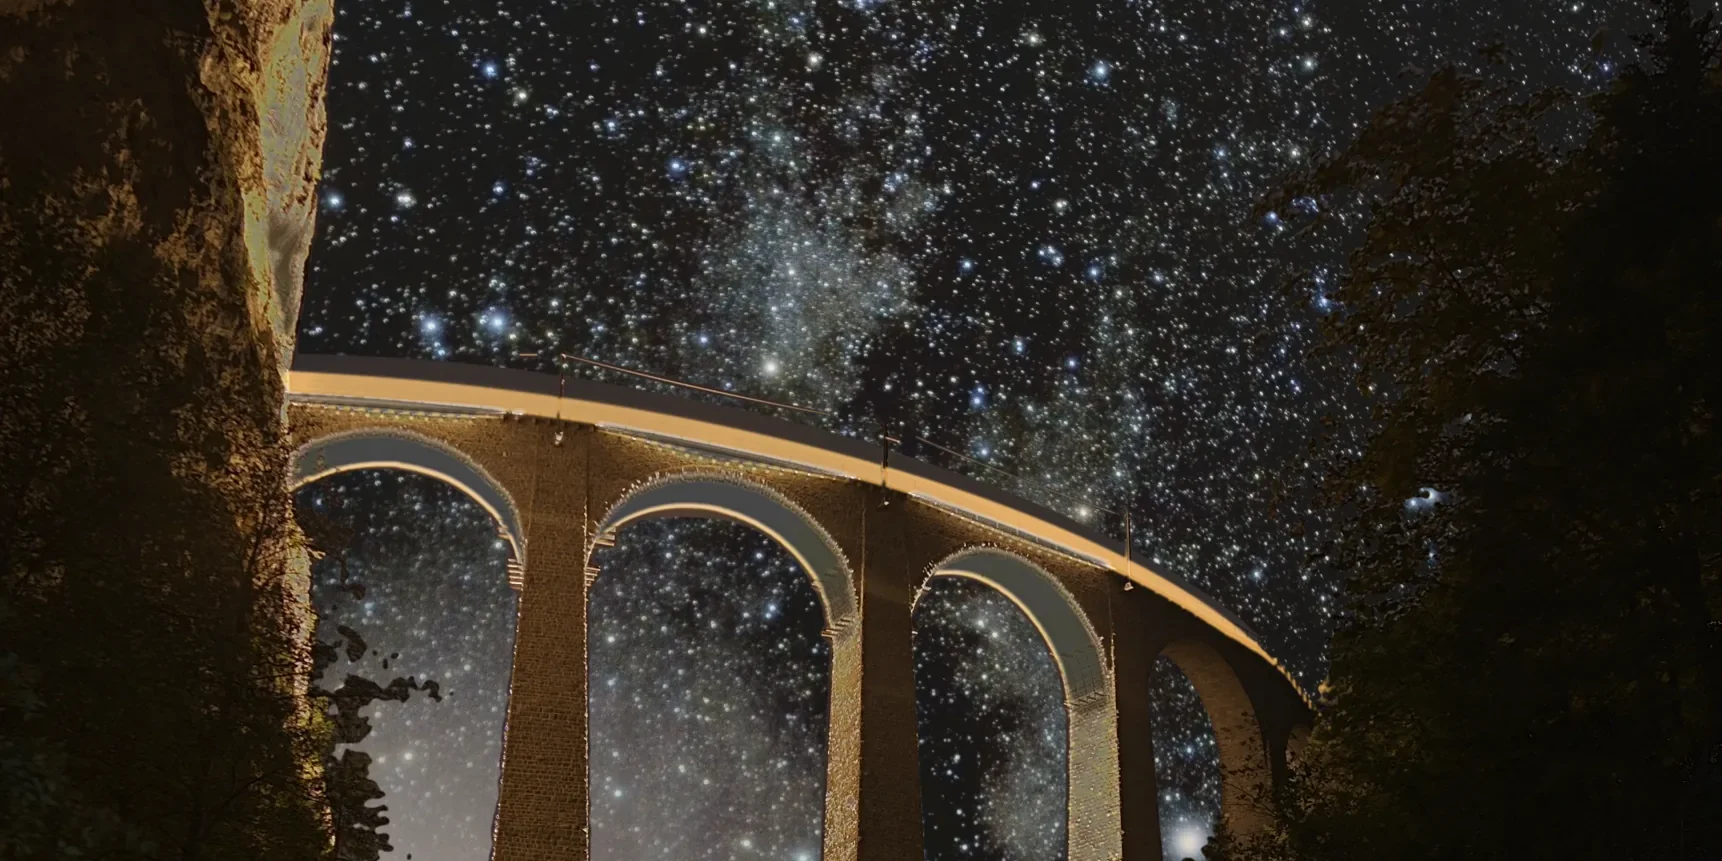
EssaySeptember 14, 2026
Harder to Catch Than a Hallucination
On 23 September 2022, outside Filisur in Switzerland, I pointed a camera at Andromeda. The galaxy spans about six full Moons of sky, yet in a wide frame it showed as a smudge barely a thirtieth of the picture’s width. Ten exposures, stacked and enlarged, turned the same pixels into a bright core inside a tilted disc.

The finished image. Filisur, 23 September 2022. Sony A7 III, Sigma 16mm F1.4 DC DN on APS-C. Ten frames, about ten minutes of exposure in total, stacked, then background-extracted and denoised. Andromeda is the elongated smudge below and right of centre.

What my own eyes saw that night was closer to the single frame than the stack.
In about 964 CE, the Persian astronomer al-Sufi, working in what is now Iran, looked at roughly the same patch of sky and recorded it in his Book of Fixed Stars as a “little cloud”.1 He had no camera and no way to combine ten exposures into one. He was not wrong. A little cloud is a fair description of what a single frame, or a single pair of eyes, shows.

Andromeda, as al-Sufi drew it. Folio 165, Book of Fixed Stars, copied 1009–10 CE, Bodleian Library.1
There was a time when the night sky was one of the largest information systems we humans had access to. For people whose lives were tied directly to agriculture, navigation, ritual and the seasons, observing it was practical: there were cycles to understand, events to anticipate and patterns to record.
And once we humans began recording those patterns, something very human happened. We began looking for meaning in them.
Seeing patterns
Ancient observers were not simply irrational people staring at the heavens and inventing stories. Across civilisations, people made remarkably careful observations of celestial cycles, recording eclipses, planetary movements, lunar phases and the appearance of stars. In many societies, observation, calendrical calculation, religion and divination were intertwined.

The recorded sky. Generated illustration of observers in Mesopotamia, today's Iraq, sighting a planet against known stars and writing it down. A reconstruction, not a historical record.
In Assyria in the seventh century BCE, in what is now northern Iraq, scholars watched the sky on the king’s behalf and sent him written reports on the Moon and the planets, halos, comets and meteors. Usually a report quoted the standard omen from the reference texts, with its meaning for the kingdom, and left out what had actually been seen: the omen was taken to imply the observation.2
The important distinction is not between people who looked at the sky scientifically and people who looked at it superstitiously. The distinction is between observation and interpretation.
Some patterns in the sky carry their causes in plain view. The Sun rises and the day begins. It climbs higher through the spring and the fields warm. Anyone watching could see that the sky and the world below moved together, and they were right: the Sun really does make the day and drive the seasons.
If a celestial configuration repeatedly appears around the same earthly event, noticing the pattern is reasonable. The next step is to ask why, and that is where things become difficult. A pattern can be real without the explanation we attach to it being correct. The reasoning that correctly ties the Sun to the day does not tie the position of Mars at a birth to the character of the child. Looking for patterns was never the mistake. The mistake is assuming that every observed or imagined pattern has a corresponding causal explanation.
Astrology was never only about predicting the future. It also became a language for uncertainty, timing, personality, authority and meaning. When the world is difficult to understand, the possibility that there is a larger system behind events can itself be comforting. That does not make every astrological claim true, but it helps explain why such systems persist.
We humans are uncomfortable with unexplained patterns. When we see something happen repeatedly, our natural reaction is that there must be something here. Sometimes there is. The intellectual challenge is working out what.
An invisible relationship can be real
Consider Rahu and Ketu in the Indian astronomical and astrological tradition. They are not physical planets in the modern astronomical sense. They correspond to the lunar nodes: the two opposite points where the Moon’s apparent path crosses the ecliptic, the Sun’s apparent annual path among the stars.

Rahu and Ketu. Generated illustration. The two bands crossing the sky are a conceptual overlay of the Moon's path meeting the ecliptic; nobody saw them there. The crossings are what the board is calculating.
These points are not objects sitting somewhere in space. They are relationships, and yet they are useful. The position of a node can be calculated and its movement modelled, and the geometry has observable consequences: an eclipse can only happen when a new or full Moon falls near one of them.
An invisible relationship can be real. Not everything that matters has to be a physical object: coordinates are not objects, constraints are not objects, and a network is not an object in the way a building is. But relationships between things can be measurable and consequential.
The failure begins with the next leap: if one invisible relationship is real, perhaps every invisible relationship we can imagine is real too.
It isn’t. The existence of a genuine underlying relationship does not validate every explanation built around it.
They did not have better eyes
People in the ancient world did not necessarily have better eyesight than we do. They had a better signal-to-noise ratio. There was no continuous electric skyglow from cities, highways and industrial sites washing out the faintest stars. That does not mean every ancient settlement had a pristine sky, with its fires, lamps, smoke and dust, but widespread artificial skyglow did not exist.
Nor did most of what competes for the eye today. A walk home now passes screens, phones, billboards, headlights, traffic signals and signage, and all of it reaches the eye whether or not we pay attention. We filter nearly all of it out without noticing. It is still input, and it is input that did not exist then. The ancient observer looked up with far less light competing with the faintest stars, and far less of everything else competing for attention.
That condition has since reversed. We have built environments in which there is vastly more information than any human can directly perceive.
When the telescope changed the problem
Astronomy eventually encountered its own information threshold. The naked eye could see only so much. Then came increasingly powerful instruments: telescopes revealed objects human eyes could never see, photography let observations accumulate, and spectroscopy revealed the composition and movement of distant objects. Each new instrument also created new kinds of data that had to be calibrated, compared and interpreted. Eventually the harder problem was processing what had been seen.
Modern astronomy operates at an entirely different scale. Instruments such as Hubble and the James Webb Space Telescope produce observations containing structures and signals far beyond unaided human perception. Computers process those observations, algorithms extract patterns, images are combined and reconstructed, and models are tested against what comes back. We build instruments that extend perception.
The Andromeda stack from that September night is a small, domestic version of the same move. Stacking fixed the noise and pulled up the depth. It did not fix everything: the stars in the frames from that session came out slightly elongated, a roundness of about 0.69 rather than a perfect 1.0, a signature of the optics and the polar alignment that no amount of stacking removes. The instrument made a richer form of observation possible, with its own residue of error built in.
Organisations reached the same threshold. Most of them reached for a different kind of instrument.
When organisations became too large to see
In many businesses, a senior manager once had a slower, more direct view of operations than is possible today. That does not mean earlier organisations were simple: large industrial enterprises, trading networks and bureaucracies have always depended on documents, accounting systems, intermediaries, hierarchies and people whose job was to make sense of information. What changed is scale, speed and cognitive reach.
Products multiplied. Supply chains went global. Customer interactions became continuous. ERP systems captured millions of transactions, sensors generated streams of operational data, planning systems produced scenarios, and documents, emails and external signals piled up alongside all of it. At some point the organisation crossed an invisible threshold: there was now more information about the business than any individual could reasonably take in. Just as the astronomer could no longer rely on the naked eye, the executive could no longer rely on direct perception.
Astronomy responded by building better instruments. Many organisations responded by compressing: into reports, then dashboards, and above all into PowerPoint.
When PowerPoint becomes astrology
Some compression is unavoidable. A board cannot consume millions of transactions, and an executive cannot read every email, inspect every SKU or understand every supplier interaction. Someone has to reduce complexity into something we can work with.
The problem begins when compression silently becomes explanation.
A thousand data points become a chart.
The chart becomes a trend.
The trend becomes a narrative.
The narrative becomes an explanation.
The explanation becomes a causal claim.
The causal claim becomes a decision before anyone has established whether it is true.

Constellatio corporata. Generated illustration. The data points stop partway across the screen; the line keeps going, and becomes a star chart.
This is what I mean by organisational astrology: not that executives are irrational, but that organisations can develop systems in which patterns turn into explanations without enough discipline between the two.
In January 2003, a piece of foam insulation broke off the Space Shuttle Columbia’s fuel tank during launch and struck its left wing. Engineers assessed the possible damage and briefed their analysis on PowerPoint slides. One slide, later reproduced in the accident investigation report, carried the title “Review of Test Data Indicates Conservatism for Tile Penetration”. It read as reassurance. A caveat buried in the final line said that the debris was far outside the model’s tested conditions: by the slide’s estimate, 640 times larger than the test pieces used for calibration. Later analysis put it at 400. The officials came away satisfied that Columbia was not in danger, and the threat was not examined further. On 1 February 2003, Columbia broke apart on re-entry and its seven crew were killed. The board called the “endemic use of PowerPoint briefing slides instead of technical papers” an illustration of NASA’s problems with technical communication.3
Most cases are quieter than that. The alternative explanations are never made visible, the predictions are never recorded, and six months later no one goes back to ask whether the causal story survived contact with reality. The organisation has moved from observation to belief without noticing the transition.
We humans need stories to make sense of complexity and act despite uncertainty. The problem is when a useful story quietly acquires the status of evidence.
The new problem is already here
AI already produces plausible meaning from overwhelming information: reading thousands of documents, comparing years of transactions, identifying correlations across systems, and returning, within seconds, a coherent explanation grounded in real data.
And it can still be wrong. Hallucination is only one failure mode, and once exposed it is relatively easy to recognise. The more difficult one is a plausible explanation: it may contain mostly true facts, connect patterns that genuinely exist, and tell a story that makes intuitive sense. The failure hides in the jump from pattern to explanation, or from explanation to causation.
A decade before today’s AI models, Google Flu Trends estimated flu levels from what people were searching for. Its engineers had screened some fifty million search terms for the ones that best matched the official figures from the US Centers for Disease Control. The pattern was real: the chosen terms did rise and fall with the flu. But some of them tracked winter rather than illness, and the engineers had to weed out searches about high school basketball. David Lazer and colleagues, who later took the model apart in Science, called the first version “part flu detector, part winter detector”. In February 2013 it was estimating more than double the share of doctor visits for flu-like illness that the CDC reported. The popular explanation was a media panic driving searches that season. Lazer’s team found it could not account for a model that had been overshooting for more than two years; changes to Google’s own search engine were the likelier cause. A plain forecast from the CDC’s own slightly delayed numbers did better.4
The ancient astrologer had relatively little data but a powerful human capacity to construct meaning from it. Modern AI has almost the opposite problem: it can process more data than anyone could read, and construct meaning from it at a speed no human can match. The difficult task now is deciding which explanations those patterns justify.
AI can become a telescope for the organisation, or it can become an extraordinarily sophisticated astrology machine. The second is already here whenever a system turns correlated metrics, fragments of operational evidence, or a large document set into a confident causal narrative without making its assumptions, counter-explanations and uncertainties visible.
The difference is not intelligence
The answer is not to stop interpreting: interpretation is essential, and we cannot return to a simpler world in which everything important could be understood directly. What we need is a way to keep what we saw separate from what we concluded. It comes down to six questions.
- Evidence. What did we actually observe?
- Inference. What did we infer from those observations?
- Alternatives. What other explanations fit the same evidence?
- Uncertainty. What information is missing, stale, contradictory or unreliable?
- Prediction. If this explanation is correct, what should we expect next? What would falsify it, and what should change if we intervene?
- Feedback. Did the prediction hold, and what did the result teach us about the model, our assumptions and the next decision?
This is what I mean by organisational astronomy: the discipline of making a complex system more observable without pretending that observation alone settles meaning. An AI system that helps us answer the six questions is doing astronomy. One that jumps from a pattern straight to a compelling story is doing astrology, however much intelligence sits behind it.
What the six questions are for
Al-Sufi did not explain his little cloud. He recorded what he saw and where he saw it, and left the question open. Nearly a thousand years later, in October 1923, Edwin Hubble photographed Andromeda with the 100-inch telescope on Mount Wilson. On that plate was a star he later identified as a Cepheid. Cepheids are pulsating stars whose rhythm gives away their true brightness, a rule Henrietta Leavitt had worked out, and from it Hubble could measure the distance. The little cloud lay far outside our own galaxy. It was a galaxy in its own right.5
Organisations cannot wait a thousand years for an answer. And the tools now arriving can find patterns at a scale no human could match: fast at the first question, and silent about the other five.
A slide deck that skipped from data to decision was always a risk. A model that can do the same thing at machine speed and machine confidence is a much bigger one.
The six questions are how we catch it: before a plausible story hardens into a decision, rather than after that decision fails.
A note on the images
The two scenes of observers and the boardroom are generated illustrations. They show what the essay describes, and nothing in them is evidence of anything. The al-Sufi page is the opposite: a real folio from a copy made about 25 years after his death, held at the Bodleian and in the public domain. I found it in a few minutes by searching open-museum.art for al-Sufi,6 which is a better way to illustrate a historical claim than asking a model to imagine one.
Sources
1. Abd al-Rahman al-Sufi, Kitab Suwar al-Kawakib al-Thabita (Book of Fixed Stars), folio 165, Bodleian Library MS Marsh 144, copied 1009–10 CE. Public domain, via Wikimedia Commons. The phrase al-latkhā al-sahābiya, “a little cloud” or “nebulous smear”, and the date of about 964 are as given by the Science Museum, “Updating stars and observing the Andromeda Galaxy”. Ian Ridpath’s Star Tales renders it “the nebulous smear”.

2. Hermann Hunger, Astrological Reports to Assyrian Kings, State Archives of Assyria 8 (Helsinki University Press, 1992), as summarised in Hisashi Hayakawa and colleagues, “The Earliest Candidates of Auroral Observations in Assyrian Astrological Reports”, The Astrophysical Journal Letters (2019). The phenomena reported, and Hunger’s point that a quoted omen made recording the observation unnecessary, are from Hayakawa’s account of Hunger’s edition.
3. Columbia Accident Investigation Board, Report, Volume I, August 2003, p. 191, “Engineering by Viewgraphs”, which reproduces the slide with Edward Tufte’s annotations. The title, the 640-fold estimate and its later correction to 400, the officials’ conclusion and the board’s finding on PowerPoint are all from this page.
4. David Lazer, Ryan Kennedy, Gary King and Alessandro Vespignani, “The Parable of Google Flu: Traps in Big Data Analysis”, Science 343 (14 March 2014): 1203–1205. The fifty million terms, the basketball searches, the “winter detector” line, the doubled estimate and the case against media panic are all from this paper.
5. NASA Science, “NASA Celebrates Edwin Hubble’s Discovery of a New Universe”. Leavitt’s rule linking a Cepheid’s pulsation to its brightness, and the distance that put Andromeda outside the Milky Way. The date of the plate, the night of 5 to 6 October 1923, and the Cepheid on it are from NASA Science, “Hubble Views the Star that Changed the Universe”.
6. open-museum.art. Search across museum collections and see what each work lets you do: view it, cite it, or print it.
Share feedback
No public comments. If you want to share a reaction or correction, send it here.